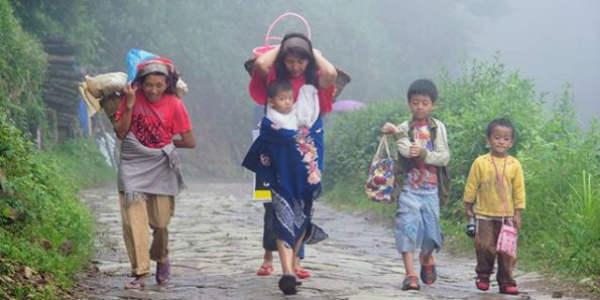
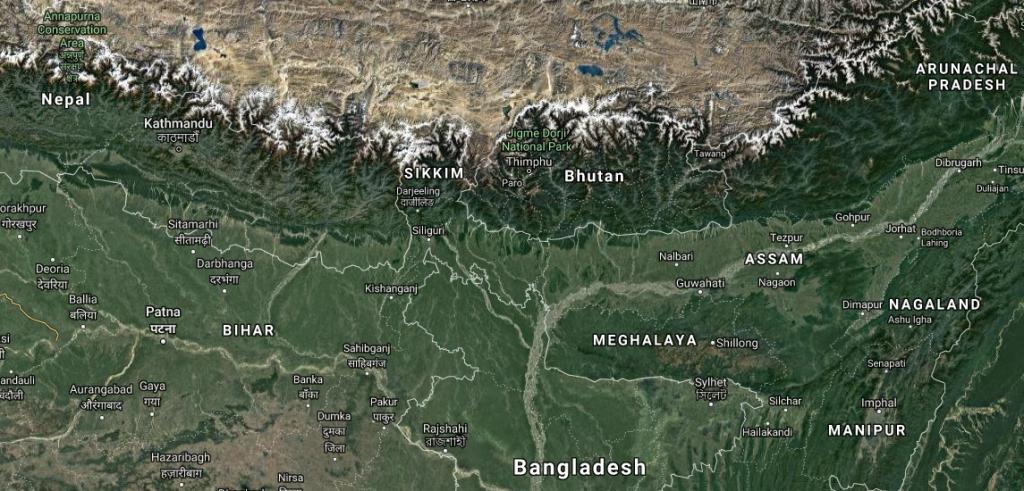
A low-pressure area, currently located over Odisha, is set to bring an intense bout of heavy to very heavy rains over the eastern and northeastern states of India on Friday.
According to The Weather Channel’s forecasters, Assam, Meghalaya and Sikkim will experience heavy to very heavy rainfall on Friday. Moreover, heavy rains are also forecast in Bihar, Jharkhand, West Bengal, Arunachal Pradesh, Nagaland, Manipur, Mizoram and Tripura.
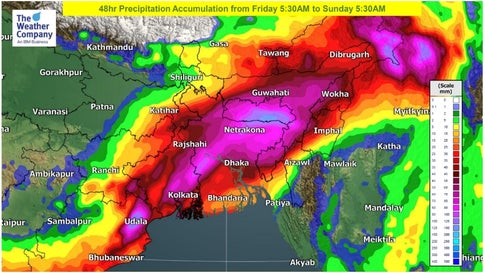
A 24-hour precipitation accumulation (i.e. total rainfall volume) of over 100mm is also possible over eastern and northeastern India on Friday, and over northeast India on Saturday.
Rainfall accumulation forecast during the next 48 hours, from Friday morning to Sunday morning(TWC Met Team)
The India Meteorological Department (IMD) also forecasts that isolated places over Assam and Meghalaya will experience thunderstorms accompanied by lightning and gusty winds (with speed up to 30-40 kmph) over the next 48 hours.
The regional met centre also forecasts the possibility of thunderstorms with lightning across northeastern states on Friday and Saturday. Gale winds of up to 40 kmph are forecast in isolated places over Assam and Meghalaya. The IMD has issued an orange level alert for these two states, while other states in the northeast have been put under a yellow watch. IMD’s orange alert signifies ‘be prepared’ for extreme weather, while yellow watch recommends to ‘be updated’.
The circulation and the related low is expected to move northeastward on Friday, and reach northeastern India on Saturday morning. The intensity of rainfall is likely to drop after Sunday, as the low-pressure loses steam.
Since the start of October, five Northeastern states (Arunachal Pradesh, Assam, Meghalaya, Mizoram and Sikkim) have experienced ‘deficit’ rainfall as compared to the normal average, while Manipur has experienced a ‘large deficit’. However, with heavy rain headed their way, these statistics could change drastically over the weekend.
For weather & air quality updates on the go, download The Weather Channel App (on Android and iOS store). It’s free!
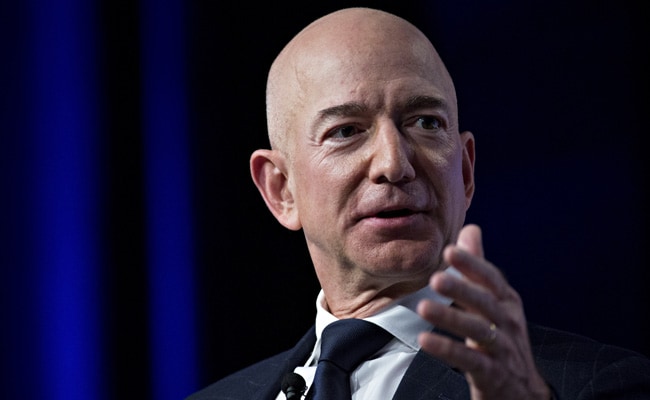
Amazon founder and CEO Jeff Bezos has lost the title as the world’s richest man, paving the way for tenacious Bill Gates to grab the top spot after Amazon’s lacklustre Q3 results resulted in Mr Bezos losing nearly $7 billion in stock value.
Amazon shares fell 7 per cent in after-hours trading on Thursday, leaving Mr Bezos down to $103.9 billion.
Microsoft co-founder Bill Gates is currently worth $105.7 billion.
Mr Bezos ended Mr Gates’ 24-year run as the richest man in 2018 and became the first man on earth with a net worth of $160 billion.
Play Video1m 24s
Amazon CEO says tabloid owner blackmailed him
Chief Executive of Amazon Jeff Bezos posts a blog saying the parent company of tabloid The National Enquirer tried to blackmail him with the threat of publishing “intimate photos.” Ryan Brooks reports.
Amazon reported a 26 per cent drop in net income in its third quarter, its first profit decline since 2017, reports Forbes.
In after-hours trading, Amazon dropped nearly 9 per cent to $1,624 per share.
Gates debuted on Forbes’ first ever billionaire list in 1987 with a net worth of $1.25 billion.
Mr Bezos first joined The Forbes 400 list of richest Americans in 1998, one year after Amazon went public, with a net worth of $1.6 billion, the report added.10 COMMENTS
The Bezos couple finalised their divorce in April in what was reported as the biggest divorce settlement in history, entitling MacKenzie Bezos to Jeff Bezos’ stocks worth around $36 billion.
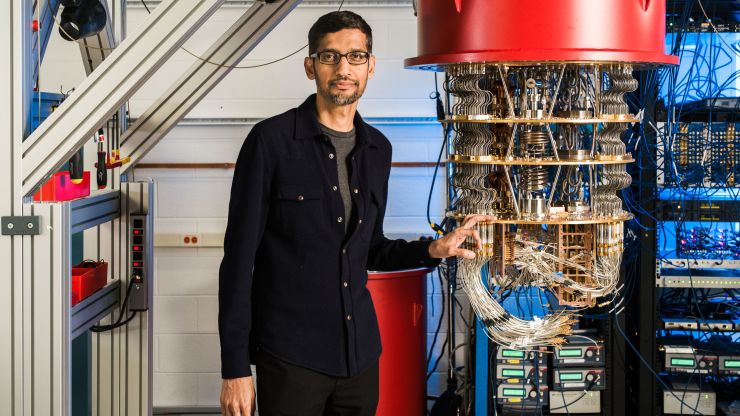
Google has a new paper in Nature that shows the results of a quantum computing experiment.
One practical application of the technology could be a decade away, Google CEO Sundar Pichai says.
Image Google CEO Sundar Pichai stands with a quantum computer a Google laboratory in Santa Barbara, CaliforniaGoogle
Alphabet subsidiary Google on Wednesday touted a breakthrough in computing research that’s documented in the latest issue of the journal Nature. The paper was actually released online by accident last month by the U.S. National Aeronautics and Space Administration, which contributed on the research alongside Google, and was quickly removed. Now the full paper is live.
There’s just one problem: IBM thinks Google has overstated its achievement.
The controversy is the latest example of major technology companies trying to one-up each other in quantum computing, a futuristic realm with no clear winner yet. Microsoft and Intel have also been working actively in the area.
Quantum computing is utterly unlike today’s computing. Our existing PCs and mobile devices express information that ultimately gets boiled down to ones and zeros. Quantum computers work in quantum bits, or qubits, which is more nuanced — information can be a one and a zero at the same time.
This technology has promise. It could come in handy to solve problems that modern computers aren’t so good at. It could improve the computing of artificial intelligence models, and it could help with materials science and chemistry work. It could even be used to break encryption one day, and Google is aware of that possibility.
Google’s Nature paper talks about an experiment that researchers conducted with a custom 54-qubit processor called Sycamore. The goal for Google was attaining quantum supremacy — essentially doing something with a quantum computer that would take an impractically long time with normal computers. Google has been focused on the challenge of quantum supremacy — a concept that dates to 2012 — for some time.
“Our Sycamore processor takes about 200 seconds to sample one instance of a quantum circuit a million times — our benchmarks currently indicate that the equivalent task for a state-of-the-art classical supercomputer would take approximately 10,000 years,” the researchers wrote in the paper.
“This dramatic increase in speed compared to all known classical algorithms is an experimental realization of quantum supremacy for this specific computational task, heralding a much-anticipated computing paradigm.”
Google tapped its own computing infrastructure as well as Summit, currently the world’s most powerful supercomputer, to simulate the quantum work and then extrapolate.
IBM took issue with the 10,000-year calculation.
“We argue that an ideal simulation of the same task can be performed on a classical system in 2.5 days and with far greater fidelity,” IBM’s Edwin Pednault, John Gunnels and Jay Gambetta wrote in a blog post. They said quantum supremacy in the strictest terms had not in fact been accomplished.
Applications in drug discovery, climate change
Leaving aside IBM’s skepticism about how long it would take a classical computer to do what Google’s chip did, the question now becomes what Google, IBM and other companies will eventually be able to do with their quantum systems.
“We are only one creative algorithm away from valuable near-term applications,” the researchers wrote in the Nature paper.
Google CEO Sundar Pichai was asked about this in an interview with MIT Technology Review. The answer suggests that the company at least has some clues about the possibilities.
“The real excitement about quantum is that the universe fundamentally works in a quantum way, so you will be able to understand nature better. It’s early days, but where quantum mechanics shines is the ability to simulate molecules, molecular processes, and I think that is where it will be the strongest. Drug discovery is a great example. Or fertilizers — the Haber process produces 2% of carbon [emissions] in the world. In nature the same process gets done more efficiently.”
The IBMers also recognized that much more work lies ahead.
“For quantum to positively impact society, the task ahead is to continue to build and make widely accessible ever more powerful programmable quantum computing systems that can implement, reproducibly and reliably, a broad array of quantum demonstrations, algorithms and programs. This is the only path forward for practical solutions to be realized in quantum computers,” they wrote.
India, Nepal and Bhutan have drafted a memorandum of understanding to create a a trans-boundary wildlife conservation ‘peace park’, Soumitra Dasgupta, inspector-general of forests (wildlife) under the environment, forest and climate change ministry told Down to Earth, the premier environment and development magazine.
“The process is in its final stage. The MoU is currently going back and forth among the countries for final changes,” he said.
The proposed Park will include biodiversity-rich landscapes in adjoining areas of the three countries, Director General of Forest Siddhanta Das told Down to Earth.
“The trans-boundary parks present a fundamental shift in which wildlife conservation is done. From a species focused approach, we are moving to a landscape based approach,” he said.
There is already one trans-boundary Protected Area in India and Bhutan, which includes the Manas landscape of Assam, and the new tripartite park will be an extension of this, Das said.
“This initiative was taken by India keeping in view the migratory wildlife species such as elephant,” Das said.
Last month a meeting was held in Bhutan where the country shared its final views with India, which were under consideration, Das said.
The process started this year, with the idea that wildlife species, their movement and conservation should not be interrupted by political boundaries.
“This project will maintain the natural connectivity of wildlife species, undisturbed by political boundaries. The project will also help the local communities through ecotourism. It will also maintain the traditional and cultural continuity of villages that share similar traditions from time immemorial, but have been separated by the political boundary. In this sense this park will be a harbinger of peace in the area,” Dasgupta said.
The process, although started by the MoEF&CC, has to involve the Ministry of External Affairs, given the multinational nature of the project.
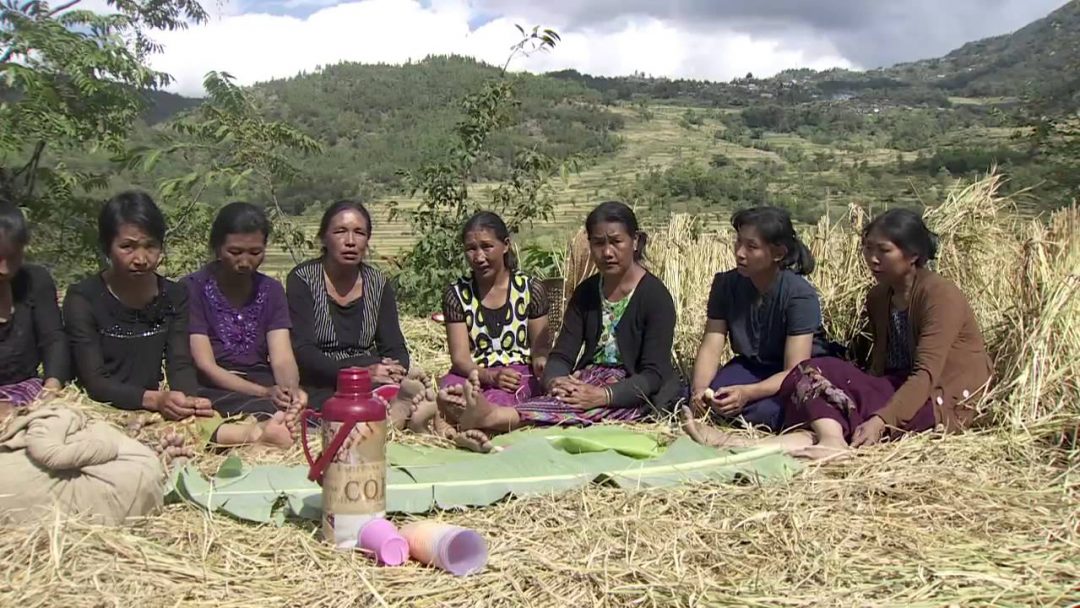
Naga Scholars’ Association (NSA) organised a special lecture on “Sustainable Community Development: Giving Back to Communities” on October 19 at the School of International Studies (SIS), Jawaharlal Nehru University (JNU).
Prof. Murari Suvedi, Michigan State University, USA, who was the speaker of the programme, shared his action research work on community development in Nepal. In response to an appeal from the community, he undertook the challenge of organizing six different developmental projects.
This was stated in a press statement issued by NSA president, Dr. Zuchamo Yanthan.
Some of the fundamental principles of sustainable community development he derived from his work includes the following points: “Farmers are not used to cooperative marketing since managing cooperative requires social and cultural change”.
He said local farmers can be empowered to manage improved production as well as marketing of farm products.
Stressing that participation of the beneficiary was inevitable and collaboration with the development partners was essential, prof. Murari said that capacity building required teamwork.
His presentation was based on the fundamental question of asking what “we” owe to each other and how one can give back to own communities, especially the least advantaged, through effective community participation for sustainable development, the statement stated.
The special lecture was chaired by prof. PVK Sasidhar, School of Extension and Development Studies, IGNOU. Dr. Zuchamo Yanthan, president of NSA opened the session with a prelude to the theme.
The rapportuer of the session was Dr.Phuireingam Hongchui, PhD scholar in JNU. Dr. Lungthuyang Riamei, general secretary of NSA, proposed vote of thanks.
On the morning of 14 November 1994, a train glided into the Gare du Nord in Paris. It had left London Waterloo three hours earlier with around 700 passengers, then meandered – frustratingly slowly in those days – through Kent. Near Folkestone it dived underground, into a tunnel bored through the chalk under the seabed, before emerging 20 minutes later near Calais, where it could at last accelerate to 186mph and finally arrive at the French capital three minutes ahead of schedule. Or rather late, perhaps, depending on how you look at it.
After all, it was nearly two centuries earlier, in 1802, that a French mining engineer named Albert Mathieu-Favier first proposed the idea of a tunnel under the Channel. It involved horse-drawn carriages and oil lamps and was quickly abandoned. Numerous other ideas and schemes followed; surveys were carried out and tunnels were even started. Digging began in 1881, but the project was ditched when British politicians and the press stirred up fears of an invasion.
Since then over 200 million passengers have travelled on the Eurostar – including the Queen, presidents, prime ministers, Beatles and Rolling Stones, ambassadors, Wags, fans, and a lot of ordinary people. I spoke to some of those passengers, and the people who helped them travel.
I drove the first train to Paris
‘I thought, blimey, that’s a lot of pressure’ … Bob Priston. Photograph: Eurostar
My co-driver Lionel Stevenson and I were told the Friday before that we were rostered on the first train to Paris. I thought: “Blimey, that’s a lot of pressure,” but we were well trained and ready to go. The day went very fast. We left Waterloo within a minute of the right time, had a pretty clear run and in northern France we accelerated to 300kmh. We were aware that it was a historic moment – that if anything went wrong, that’s what would be reported.
Before that I was an InterCity driver on British Rail. The Eurostar train is a lot faster; we loved that, but it was something we had to get used to. Then there were the different signalling systems; French and Belgian rules and regulations. We were given 600 hours of French language training, including two residential stays in France.
It always gives you a buzz, going into the tunnel, especially if you get slowed down on the approach and then accelerate into the tunnel. We don’t get much overtaking us. The nearest I’ve come to it was many years ago when there was a 170kph speed restriction in France. There was a BMW on the left-hand side, just in front of the train. As we came off the speed restriction I looked over and he was accelerating at the same rate, up to about 250-260kph, before I gently eased past him.
We had a couple of stowaways once. They were on the outside of the train and were spotted as we left Lille for London. There are a number of places – without giving too much away – where you can wedge yourself in. As we approached Calais I was told we would stop and the French police took them away.
And I have had a couple of fatalities. It’s not a pleasant side of the job. It takes a while to get your head around. The company provides counsellors. There’s nothing we can do about it – that’s the starting place for dealing with it, but it’s not pleasant, especially when you find out a bit about the people involved.
Bob Priston, train driver.
I met my husband on the Eurostar
‘I thought, I’m going to take a chance’ … Jenny and Chris Wheeler at their wedding
Advertisement
In 2002 I was studying English and went to live in London, but eventually ran out of money and had to go home to Paris. I had come to the UK with one suitcase, but when it was time to go back I had three, so I left some behind. I was on my final trip from Paris to London to pick up the last suitcase when I met my husband. He was on a business trip and wasn’t even supposed to be on that train – he had just missed the previous one. I did notice him in the queue, but he wasn’t my type, if I’m honest – although there was something nice about him. Then, when I came to sit next to him on the train, I thought: “Oh, it’s that guy.”
We both had Discmans and that was probably the start of the conversation: “Ooh, what are you listening to?” I was probably listening to PJ Harvey and Radiohead – he was more dance. He’s a DJ at heart, even if he has to work in the City.
He offered me a beer. I think I spilled a bit on him. I offered him a Bonne Maman chocolate tartlet – it’s really cliched! We were talking in English for the first hour and a half, then suddenly he spoke French. He had kept that one quiet. I was quite impressed. It was a fun three hours. I didn’t think “I’m falling in love”, but we exchanged numbers.
I told my friends how I had met this guy, he was nice, carried my suitcase – the embodiment of the proper Englishman. They said, you’ve got to call him. I went back to Paris and we arranged to meet, because he was coming to Paris again. We went to one of those bars opposite Gare du Nord. I went to the UK maybe a couple of weeks later, to see him. We got on so well I decided to move in. I had quite a good job in Paris, but I thought: “I’m still young, I’m going to take a chance.”
Jenny Wheeler lives with Chris and their two children on the Essex/Suffolk border.
I helped build the tunnel
I’m actually sitting on the Eurostar right now, leaving in seven minutes. I was public affairs manager for Eurotunnel, involved in the tunnel and the start of services. I’ve been following it ever since. In 1980 or 81 Margaret Thatcher indicated that if a fixed link across the Channel could be built and financed without public money, then we could do it. We had people from Dover Harbour Board saying the tunnel was going to be the longest crematorium in the world – we had to struggle against that.
The decision to make it a rail tunnel was very significant. Some of the alpine road tunnels have had lots of problems, as well as the issues of exhaust emissions. But Mrs Thatcher didn’t like trains, she liked cars. When she asked our chairman how you get the cars across, he said: “Oh, you put them on shuttles,” and she never asked what a shuttle was. Of course, it was a train.Advertisement
I always thought it was an important way of linking us to the continent – not just business, but pleasure and culture. The train has helped integrate communities in a way that didn’t happen before. That’s what’s so sad about Brexit: they are doing their best to wreck it.
Anthony Fitzhardinge Gueterbock, Lord Berkeley.
The Eurostar is at the centre of my marriage
Backwards and forwards at weekends … Bryony Hoskins on the Eurostar. Photograph: Provided by Bryony Hoskins
Antoine was a software engineer who came to the UK when they were building the tunnel under London in about 1998. We met by chance in a London bar – I was a sociology student at Brunel University on a girls’ night out. We married in 2010. I live in London and he lives in Paris. We travel by Eurostar backwards and forwards to see each other at weekends. He comes twice a month, I go one weekend over there, or I stay longer because I have more flexibility. I do an art course and even did a big model of the Eurostar, with pictures of myself and Antoine inside.
Bryony Hoskins is a professor of comparative social science at the University of Roehampton.
I was a passenger on the first train to Paris
The most disappointing thing was that you never actually saw the sea: it’s because of the way the tunnel had to start in front of a hill on the British side and takes you quite a way beyond Calais. It’s a brilliant piece of railway engineering: I’ve travelled in the cab, an amazing experience. But the other great disappointment is that Brexit has happened. Despite the fact you can hop on the Eurostar and end up in France, it hasn’t made us feel more European. As a railway person I’m loath to say it, but maybe itwould have been better if you could have driven across. It might have made for more casual connections.
It’s undoubtedly the best way to travel between London, Paris and Brussels. But if you want to go to Amsterdam it only works one way round. Eurostar doesn’t sell tickets to many destinations either, so it’snot really connecting us to lots of places in Europe. Kent is one of the most pro-Brexit areas. If they had connected France with England on that kind of level it would have done enormous amounts for European relations. Instead it’s almost like taking a plane – you have to go to St Pancras or Ashford International, through security. If you go from France to Belgium or France to Italy you just hop on a train or in the car and you’re there.
You can’t blame Brexit on Eurostar, but it could have done more to prevent it. It has missed an opportunity – politically, symbolically and culturally.Advertisement
Christian Wolmar, writer and railway historian.
I commute on the Eurostar
Boulogne-based … Harry Dobbs and his wife Bernice Pan. Photograph provided by Bernice Pan
I’m an architect and my wife and I were looking at a site to build a property by the sea near Rye. Just the site alone was something like £600,000. It was a clear day and we could see France – that sort of piqued our interest. I do a lot of urban design, using maps to analyse how close things are in time, rather than distance. If you put a pin in King’s Cross – where my wife Bernice and I both work – in one of these interactive maps, most of northern France is closer in time than most of south-east England: Eurostar stretches northern France into what would, timewise, be considered a suburb of London. It’s 55 minutes to Calais-Fréthun. So we came over for the weekend, looked at eight properties and chose the fourth – in the old town of Boulogne, between the cathedral and the castle.
We both run our own businesses and commute every day or weekly, as we see fit. Obviously it’s expensive; if I did it every day it would be double or triple what I would pay for a Brighton season ticket – but you would need several lifetimes of that before you got near the cost of property differential. I used to come up from Brighton and sit in someone’s armpit – if the train worked at all. In general I would say the prices in northern France are 10% of south-east England’s: not 10% off, 10% of. The house next door to ours, once occupied by the writer Alain-René Lesage, who wrote Gil Blas, just sold for 40,000 euros.Advertisement
We spend our weekends walking on the beautiful beaches, cliffs and dunes of the Côte d’Opale national park and eating some of the best seafood in Europe.
Harry Dobbs, Boulogne.
My train broke down for a night
I commute weekly between Brussels and London, and in November 2014 I was on a train that broke down in northern France, en route to Brussels. After a while the power went out; it was around 9pm and we were sitting in darkness. It quickly became apparent we would be stuck for a long time. Everyone made a dash for the bar, which sold out in about 20 minutes. It was cold outside, but when the aircon broke the carriage warmed up. The problem was that the train was on a bend and tilted, which meant we were all leaning to the right (or the left if facing backwards). In the end we spent the whole night on the train, trying to sleep, while leaning to the right.
Finally we were towed away by another train and arrived in Brussels at 6am – nine hours late. The woman next to me listened to nothing but Coldplay (loudly) during the delay. Everyone’s phone batteries started to run out except hers, which went on for ever. It was a very long night.
Paul, who did not want to give his surname.
I had sex on the Eurostar and founded the 45 Metre Underground Club
I was with my girlfriend – it was 2011, we hadn’t been going out long. It was a morning train. I think we did have a drink on the train, but we were very much in control of our senses. I had the idea as we were heading out of St Pancras. She didn’t take much persuasion: it was a sort of pioneering thing. I imagine we weren’t the first to do it, but we were the first to do it in the spirit of this new club we wanted to set up.
The Mile High Club is aspirational: what could be sexier and naughtier than sex on a plane? But now flight shame puts the Mile High Club in a different light. The 45 Metre Underground Club is the low-carbon option. But you have to be doing it when you are under the Channel.
Honestly, I think we were in there for about five or 10 minutes, before emerging gingerly but extremely pleased with ourselves. I would absolutely recommend it. There is a huge body of water above you, you are hurtling along at high speed through a dark tunnel under the Channel, knowing you are on a low-carbon adventure.
One cold November evening I boarded a 7pm train at St Pancras. The journey proceeded through the tunnel, across the flat French countryside and I was looking forward to checking into my hotel. Suddenly there was a loud bang, followed by an all-consuming scraping noise that seemed to go on for ever. Eventually we ground to a halt.
We saw train staff wandering around outside with torches. After an hour, we finally started up again. There was a very loud grinding noise, then we stopped. After two to three hours of further waiting, we finally had an announcement: “Your Eurostar has hit a wild boar and is badly damaged.” They didn’t tell us what happened to the boar, but I guess that at 180mph it had probably been quite badly damaged too.
Time passed: another two hours; three hours. But the bar was open and the wifi was working. We were stuck, but it was comfortable. Eventually, at about 4am, they commandeered another train and towed our broken Eurostar into a nearby station at about 10mph. We finally made it into Paris shortly after 8am, where they left us with a free breakfast, huge apologies, a full refund and tickets for another free trip.
Chris Allen lives in Suffolk.
I sat next to the England Wags
‘They were very jolly’ … wives and girlfriends of the England football team, World Cup 1998. Photograph: Clive Limpkin/Daily Mail/Rex/Shutterstock
I was returning home to Brussels in 1998. The train got almost to the tunnel, had a problem and had to turn back to London. Eventually we were all bussed to a hotel near Wembley stadium. The following morning I insisted on a place on an early train. I had a first-class ticket and argued I should be able to get back to work asap. Eventually I was given a ticket rather grudgingly and collected a free copy of the Daily Telegraph at Waterloo. Before boarding I read an illustrated article about the England football team’s wives. This was before the term “Wags” was in use, but it was the World Cup and that evening England were playing Argentina. When I found my carriage a man tried to stop me boarding, saying the carriage was fully booked, but I insisted on getting on. The carriage had few people in it, all women under 35, very well dressed.
My seat was at a table of four. The three women all knew each other, and another seated across the aisle. I offered to swap places so they could sit together. Gradually it dawned on me this was a carriage reserved for the
wives and girlfriends of the England team. I remember recognising Paul Scholes’s wife from the picture. I think Victoria Beckham was the only one not present. They were very jolly. I thought the last thing they wanted was a male trying to engage in conversation. I would just sit back and tell my mates about it. At Lille they all departed, exiting the carriage in a wave of expensive fragrance.
Tom, who did not wish to give his surname.England lost to Argentina on penalties.
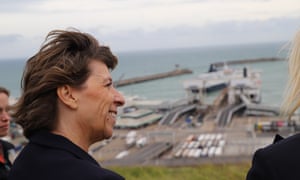
I am the French ambassador
‘I always take the Eurostar’ … Catherine Colonna on her visit to Dover and Folkestone. Photograph: the French embassy
A few days after my arrival in September I went to Dover to see the traffic and the harbour – preparedness, shall we say, on the English side, for various scenarios. I went to Folkestone as well. In the operations centre there is a photograph of Mme Thatcher and President Mitterrand when they signed that agreement in 1986. Seeing it made me think that great vision is needed in politics. There had been talk about it for so long, but they actually decided to do it. And it works. It is the easiest, safest, most ecological way from the UK to France and the continent. I always take the Eurostar. It symbolises that we are so close to each other. When I visited Dover, you could see France from the cliffs. It’s not my job to make predictions, but I can’t say I think much will change. My guess is just as many people will travel from one country to the other, as before. The Channel will not become wider overnight.
Catherine Colonna is France’s ambassador to the UK.
I wore a banana-yellow jacket to serve drunk rugby fans, the wrong Rolling Stone and the right Beatle
‘The idea was to sell as much produce as possible’ … Eurostar staff at Waterloo. Photograph: Sipa/Rex/Shutterstock
I served on the Eurostar for two summers, 1998 and 99, to pay off my student debts. I went to the interview thinking I could speak fluent French, but completely froze. They still gave me the job.
We had to be on the platform an hour and 15 minutes before departure to get the train ready. We had these banana-yellow blazers, designed by Pierre Balmain, with a yellow and blue clip-on bowtie. It was horrendous. The idea, if you were working in standard class, was to sell as much produce as possible and 1999 was the Rugby World Cup – I’ve never seen so many people drink so much alcohol in my life: when Wales were playing France in Paris, the whole train ran out.
Once, when we were preparing the train to depart at Gare du Nord, the French crew were very excited because Mick Jagger was on the platform. I thought, that is actually an A-list celebrity, worth a look, so I went out. It was actually Charlie Watts, but I didn’t want to disappoint my colleagues by correcting them. In those days, one of the carriages was dedicated to what was called premium class. The only person who regularly travelled premium was Paul McCartney. His daughter was just starting work for Chloé in Paris. He would always refuse the food and fill out a comments card saying the vegetarian options would be better if it used Linda McCartney food.
The job was good fun and very well-paid, for what it was: bilingual coffee serving. I liked chatting in French and it cleared my overdraft. Twice. I kept my banana-yellow blazer for a few years afterwards.
Tom Wolfe is now an English literature teacher in Yangon, Myanmar.
I got my A-level results on the Eurostar
I was going to the south of France on holiday with my boyfriend. For some reason we booked for the day my A-level results were coming out. It was an early train, and as soon as I could ring the school I did. I didn’t want to call in front of everyone, so I went to the little space between the carriages. The teacher was a methodical man who often took quite a long time to say what he wanted. He eventually found my name, then had to check the results. I was getting kind of stressed, because we were going to go into the tunnel soon and I would have to wait another 20 minutes.
I got 4 As: French, Spanish, English and Drama. I was really pleased. I went back to my seat where my boyfriend was waiting with a little bottle of champagne. I remember the rest of the holiday, but not as vividly as that moment.
Jennie Burke lives in Paris with her French husband Julien and four-year-old daughter Octavie.
A joint report from The Hamilton Project and the Stanford Institute for Economic Policy Research
INTRODUCTION: SCIENTIFIC BACKGROUND
Substantial Biophysical Damages Will Occur in the Absence of Strong Climate Policy Action
The world’s climate has already changed measurably in response to accumulating greenhouse gas (GHG) emissions. These changes as well as projected future disruptions have prompted intense research into the nature of the problem and potential policy solutions. This document aims to summarize much of what is known about both, adopting an economic lens focused on how ambitious climate objectives can be achieved at the lowest possible cost.
Considerable uncertainties surround both the extent of future climate change and the extent of the biophysical impacts of such change. Notwithstanding the uncertainties, climate scientists have reached a strong consensus that in the absence of measures to reduce GHG emissions significantly, the changes in climate will be substantial, with long-lasting effects on many of Earth’s physical and biological systems. The central or median estimates of these impacts are significant. Moreover, there are significant risks associated with low probability but potentially catastrophic outcomes. Although a focus on median outcomes alone warrants efforts to reduce emissions of GHGs, economists argue that the uncertainties and associated risks justify more aggressive policy action than otherwise would be warranted (Weitzman 2009; 2012).
The scientific consensus is expressed through summary documents offered every several years by the United Nations–sponsored Intergovernmental Panel on Climate Change (IPCC). These documents indicate the projected outcomes under alternative representative concentration pathways (RCPs) for GHGs (IPCC 2014). Each of these RCPs represents different GHG trajectories over the next century, with higher numbers corresponding to more emissions (see box 1 for more on RCPs).
The expected path of GHG emissions is crucial to accurately forecasting the physical, biological, economic, and social effects of climate change. RCPs are scenarios, chosen by the IPCC, that represent scientific consensus on potential pathways for GHG emissions and concentrations, emissions of air pollutants, and land use through 2100. In their most-recent assessment, the IPCC selected four RCPs as the basis for its projections and analysis. We describe the RCPs and some of their assumptions below:
RCP 2.6: emissions peak in 2020 and then decline through 2100.
RCP 4.5: emissions peak between 2040 and 2050 and then decline through 2100.
RCP 6.0: emissions continue to rise until 2080 and then decline through 2100.
RCP 8.5: emissions rise continually through 2100.
The IPCC does not assign probabilities to these different emissions pathways. What is clear is that the pathways would require different changes in technology and policy. RCPs 2.6 and 4.5 would very likely require significant advances in technology and changes in policy in order to be realized. It seems highly unlikely that global emissions will follow the pathway outlined in RCP 2.6 in particular; annual emissions would have to start declining in 2020. By contrast, RCPs 6.0 and 8.5 represent scenarios in which future emissions follow past trends with minimal to no change in policy and/or technology.
The four RCPs imply different effects on global temperatures. Figure A indicates the projected increases in temperature associated with each RCP scenario (relative to preindustrial levels).[1] The figure suggests that only the significant reductions in emissions underlying RCPs 2.6 and 4.5 can stabilize average global temperature increases at or around 2°C. Many scientists have suggested that it is critical to avoid increases in temperature beyond 2°C or even 1.5°C—larger temperature increases would produce extreme biophysical impacts and associated human welfare costs. It is worth noting that economic assessments of the costs and benefits from policies to reduce CO2 emissions do not necessarily recommend policies that would constrain temperature increases to 1.5°C or 2°C. Some economic analyses suggest that these temperature targets would be too stringent in the sense that they would involve economic sacrifices in excess of the value of the climate-related benefits (Nordhaus 2007, 2017). Other analyses tend to support these targets (Stern 2006). In scenarios with little or no policy action (RCPs 6.0 and 8.5), average global surface temperature could rise 2.9 to 4.3°C above preindustrial levels by the end of this century. One consequence of the temperature increase in these scenarios is that sea level would rise by between 0.5 and 0.8 meters (figure B).
Countries’ Relative Contributions to CO2 Emissions Are Changing
The extent of climate change is a function of the atmospheric stock of CO2 and other greenhouse gases, and the stock at any given point in time reflects cumulative emissions up to that point. Thus, the contribution a given country or region makes to global climate change can be measured in terms of its cumulative emissions.
Up to 1990, the historical responsibility for climate change was primarily attributable to the more-industrialized countries. Between 1850 and 1990, the United States and Europe alone produced nearly 75 percent of cumulative CO2 emissions (see figure C). Such historic responsibility has been a primary issue in debates about how much of the burden of reducing current and future emissions should fall on the shoulders of developed versus developing countries.
<img class=”aligncenter wp-image-619313 size-article-outset lazyload” src=”https://i1.wp.com/www.brookings.edu/wp-content/uploads/2019/10/20191018_ES_THP_ClimateFacts_Figure_C.jpg” alt=”Share of Cumulative CO2 Emissions by Geographic Region, 1850-1990 and 1850-2017″ />
Although the United States and other developed nations continue to be responsible for a large share of the current excess concentration of CO2, relative contributions and responsibilities are changing. As of 2017, the United States and Europe accounted for just over 50 percent of cumulative CO2 emitted into the atmosphere since 1850. A reason for this sharp decline (as indicated in figures C and D) is that CO2 emissions from China, India, and other developing countries have grown faster than emissions from the developed countries (though amongst major economies, the United States has one of the highest rates of per capita emissions in the world and is far ahead of China and India [Joint Research Centre 2018]). Therefore, it seems likely that in order to avert the worst effects of climate change, emissions reduction efforts will be required by both historic contributors—the United States and Europe—as well as more recently developing countries such as China and India.
<img class=”aligncenter wp-image-619313 size-article-outset lazyload” src=”https://i1.wp.com/www.brookings.edu/wp-content/uploads/2019/10/20191018_ES_THP_ClimateFacts_Figure_D.jpg” alt=”Annual CO2 Emissions by Geographic Region, 1950-2017″ />
Nations’ Pledges under the Paris Agreement Imply Significant Reductions in Emissions, but Not Enough to Avoid a 2°C Warming
The future of climate change might seem dismal in light of the recent increase in global emissions as well as the potential future growth in emissions, temperatures, and sea levels under RCPs 6.0 and 8.5. Failure to take any climate policy action would lead to annual emissions growth rates far above those that would prevent temperature increases beyond the focal points of 1.5°C and 2°C (figure E). As indicated earlier, cost-benefit analyses in various economic models lead to differing conclusions as to whether it is optimal to constrain temperature increases to 1.5°C or 2°C (Nordhaus 2007, 2016; Stern 2006).[2] Fortunately, countries have been taking steps to combat climate change, referred to in figure E as “Current policy” (which includes policy commitments made prior to the 2015 Paris Agreement). Comparing “No climate policies” and “Current policy” shows that the emissions reduction implied by current policies will lead to roughly 1°C lower global temperature by the end of the century. A large share of this lowered emission path is attributable to actions by states, provinces, and municipalities throughout the world.
Further reductions are implied by the 2015 Paris Agreement, under which 195 countries pledged to take additional steps. The Paris Agreement’s pledges, if met, would keep global temperatures 0.5°C lower than “Current policy” and about 1.5°C lower than “No climate policy” in 2100 (see figure E). Although this can be viewed as a positive outcome, a morenegative perspective is that these policies would still allow temperatures in 2100 to be 2.6 to 3.2°C above preindustrial levels—significantly above the 1.5 or 2.0°C targets that have become focal points in policy discussions.
In the following set of facts, we describe the costs of climate change to the United States and to the world as well as potential policy solutions and their respective costs.
Fact 1: Damages to the U.S. economy grow with temperature change at an increasing rate.
The physical changes described in the introduction will have substantial effects on the U.S. economy. Climate change will affect agricultural productivity, mortality, crime, energy use, storm activity, and coastal inundation (Hsiang et al. 2017).
In figure 1 we focus on the economic costs imposed by climate change in the United States for different cumulative increases in temperature. It is immediately apparent that economic costs will vary greatly depending on the extent to which global temperature increase (above preindustrial levels) is limited by technological and policy changes. At 2°C of warming by 2080–99, Hsiang et al. (2017) project that the United States would suffer annual losses equivalent to about 0.5 percent of GDP in the years 2080–99 (the solid line in figure 1). By contrast, if the global temperature increase were as large as 4°C, annual losses would be around 2.0 percent of GDP. Importantly, these effects become disproportionately larger as temperature rise increases: For the United States, rising mortality as well as changes in labor supply, energy demand, and agricultural production are all especially important factors in driving this nonlinearity.
Looking instead at per capita GDP impacts, Kahn et al. (2019) find that annual GDP per capita reductions (as opposed to economic costs more broadly) could be between 1.0 and 2.8 percent under IPCC’s RCP 2.6, and under RCP 8.5 the range of losses could be between 6.7 and 14.3 percent. For context, in 2019 a 5 percent U.S. GDP loss would be roughly $1 trillion.
There is, of course, substantial uncertainty in these calculations. A major source of uncertainty is the extent of climate change over the next several decades, which depends largely on future policy choices and economic developments—both of which affect the level of total carbon emissions. As noted earlier, this uncertainty justifies more aggressive action to limit emissions and thereby help insure against the worst potential outcomes.
It is also important to highlight what figure 1 leaves out. Economic effects that are not readily measurable are excluded, as are costs incurred by countries other than the United States. In addition, if climate change has an impact on the growth rate (as opposed to the level) of output in each year, then the impacts could compound to be much larger in the future (Dell, Jones, and Olken 2012).[3]
Fact 2: Struggling U.S. counties will be hit hardest by climate change.
The effects of climate change will not be shared evenly across the United States; places that are already struggling will tend to be hit the hardest. To explore the local impacts of climate change, we use a summary measure of county economic vitality that incorporates labor market, income, and other data (Nunn, Parsons, and Shambaugh 2018), paired with county level costs as a share of GDP projected by Hsiang et al. (2017).[4]
Figure 2 shows that the bottom fifth of counties ranked by economic vitality will experience the largest damages, with the bottom quintile of counties facing losses equal in value to nearly 7 percent of GDP in 2080–99 under the RCP 8.5 scenario (a projection that assumes little to no additional climate policy action and warming of roughly 4.3°C above preindustrial levels).[5] Counties that will be hit hardest by climate change tend to be located in the South and Southwest regions of the United States (Muro, Victor, and Whiton 2019). Rao (2017) finds that nearly two million homes are at risk of being underwater by 2100, with over half of those being located in Florida, Louisiana, North Carolina, South Carolina, and Texas. More-prosperous counties in the United States are often in the Northeast, upper Midwest, and Pacific regions, where temperatures are lower and communities are less exposed to climate damage.
An important limitation of these estimates is that they assume that population in each county remains constant over time (Hsiang et al. 2017).[6] To the extent that people will adjust to climate change by moving to less-vulnerable areas, this adjustment could help to diminish aggregate national damages but may exacerbate losses in places where employment falls. Moreover, the limited ability of low-income Americans to migrate in response to climate change exposes them to particular hardship (Kahn 2017).
The concentration of climate damages in the South and among low-income Americans implies a disproportionate impact on minority communities. Geographic disadvantage is overlaid with racial disadvantage (Hardy, Logan, and Parman 2018), and Black, Latino, and indigenous communities are likely to bear a disproportionate share of climate change burden (Gamble and Balbus 2016).
Fact 3: Globally, low-income countries will lose larger shares of their economic output.
Unlike other pollutants that have localized or regional effects, GHGs produce global effects. These emissions constitute a negative spillover at the widest scale possible: For example, emissions from the United States contribute to warming in China, and vice versa. Moreover, some places are much more exposed to economic damages from climate change than are other places; the same increase in atmospheric carbon concentration will cause larger per capita damages in India than in Iceland.
This means that carbon emissions and the damages from those emissions can be (and, in fact, are) distributed in very different ways. Figure 3 shows impacts on per capita GDP based on a study of the GDP growth effects of warming, highlighting the relatively high per capita income reductions in Latin America, Africa, and South Asia (though higher-income countries would lose more absolute aggregate wealth and output because of their higher levels of economic activity). The figure also uses a higher estimate of potential economic damages that takes into account impacts on productivity and growth that accumulate over time as opposed to looking at snapshots of lost activity in a given year. Thus, the estimates are higher than those presented in facts 1 and 2, highlighting both the uncertainty and the potentially disastrous outcomes that are possible.
Beyond showing the potentially destructive scale, this map suggests global inequity: Several of the regions that contribute relatively little to the climate change problem—regions with relatively low per capita emissions—nevertheless suffer relatively high climate damages per capita.
Fact 4: Increased mortality from climate change will be highest in Africa and the Middle East.
The reductions in economic output highlighted in fact 3 are not the only damages expected from climate change. One important example is the effect of climate change on mortality. In places that already experience high temperatures, climate change will exacerbate heat-related health issues and cause mortality rates to rise.
Figure 4 relies on estimates from Carleton et al. (2018) to show climate change’s expected effects on mortality in 2100. The geographical distribution of the impact on mortality is very uneven. Some of the most-significant impacts are in the equatorial zone because these locations are already very hot, and high temperatures become increasingly dangerous as temperatures rise further. For example, Accra, Ghana is projected to experience 160 additional deaths per 100,000 residents. In colder regions, mortality rates are sometimes predicted to fall, reflecting decreases in the number of dangerously cold days: Oslo, Norway is projected to experience 230 fewer deaths per 100,000. But for the world as a whole, negative effects are predominant, and on average 85 additional deaths per 100,000 will occur (Carleton et al. 2018).
Also evident in figure 4 is the role of income. Wealthier places are better able to protect themselves from the adverse consequences of climate change. This is a factor in projections of mortality risk from climate change: the bottom third of countries by income will experience almost all of the total increase in mortality rates (Carleton et al. 2018).
Mortality effects are disproportionately concentrated among the elderly population. This is true whether the effects are positive (when dangerously cold days are reduced) or negative (when dangerously hot days are increased) (Carleton et al. 2018; Deschenes and Moretti 2009).
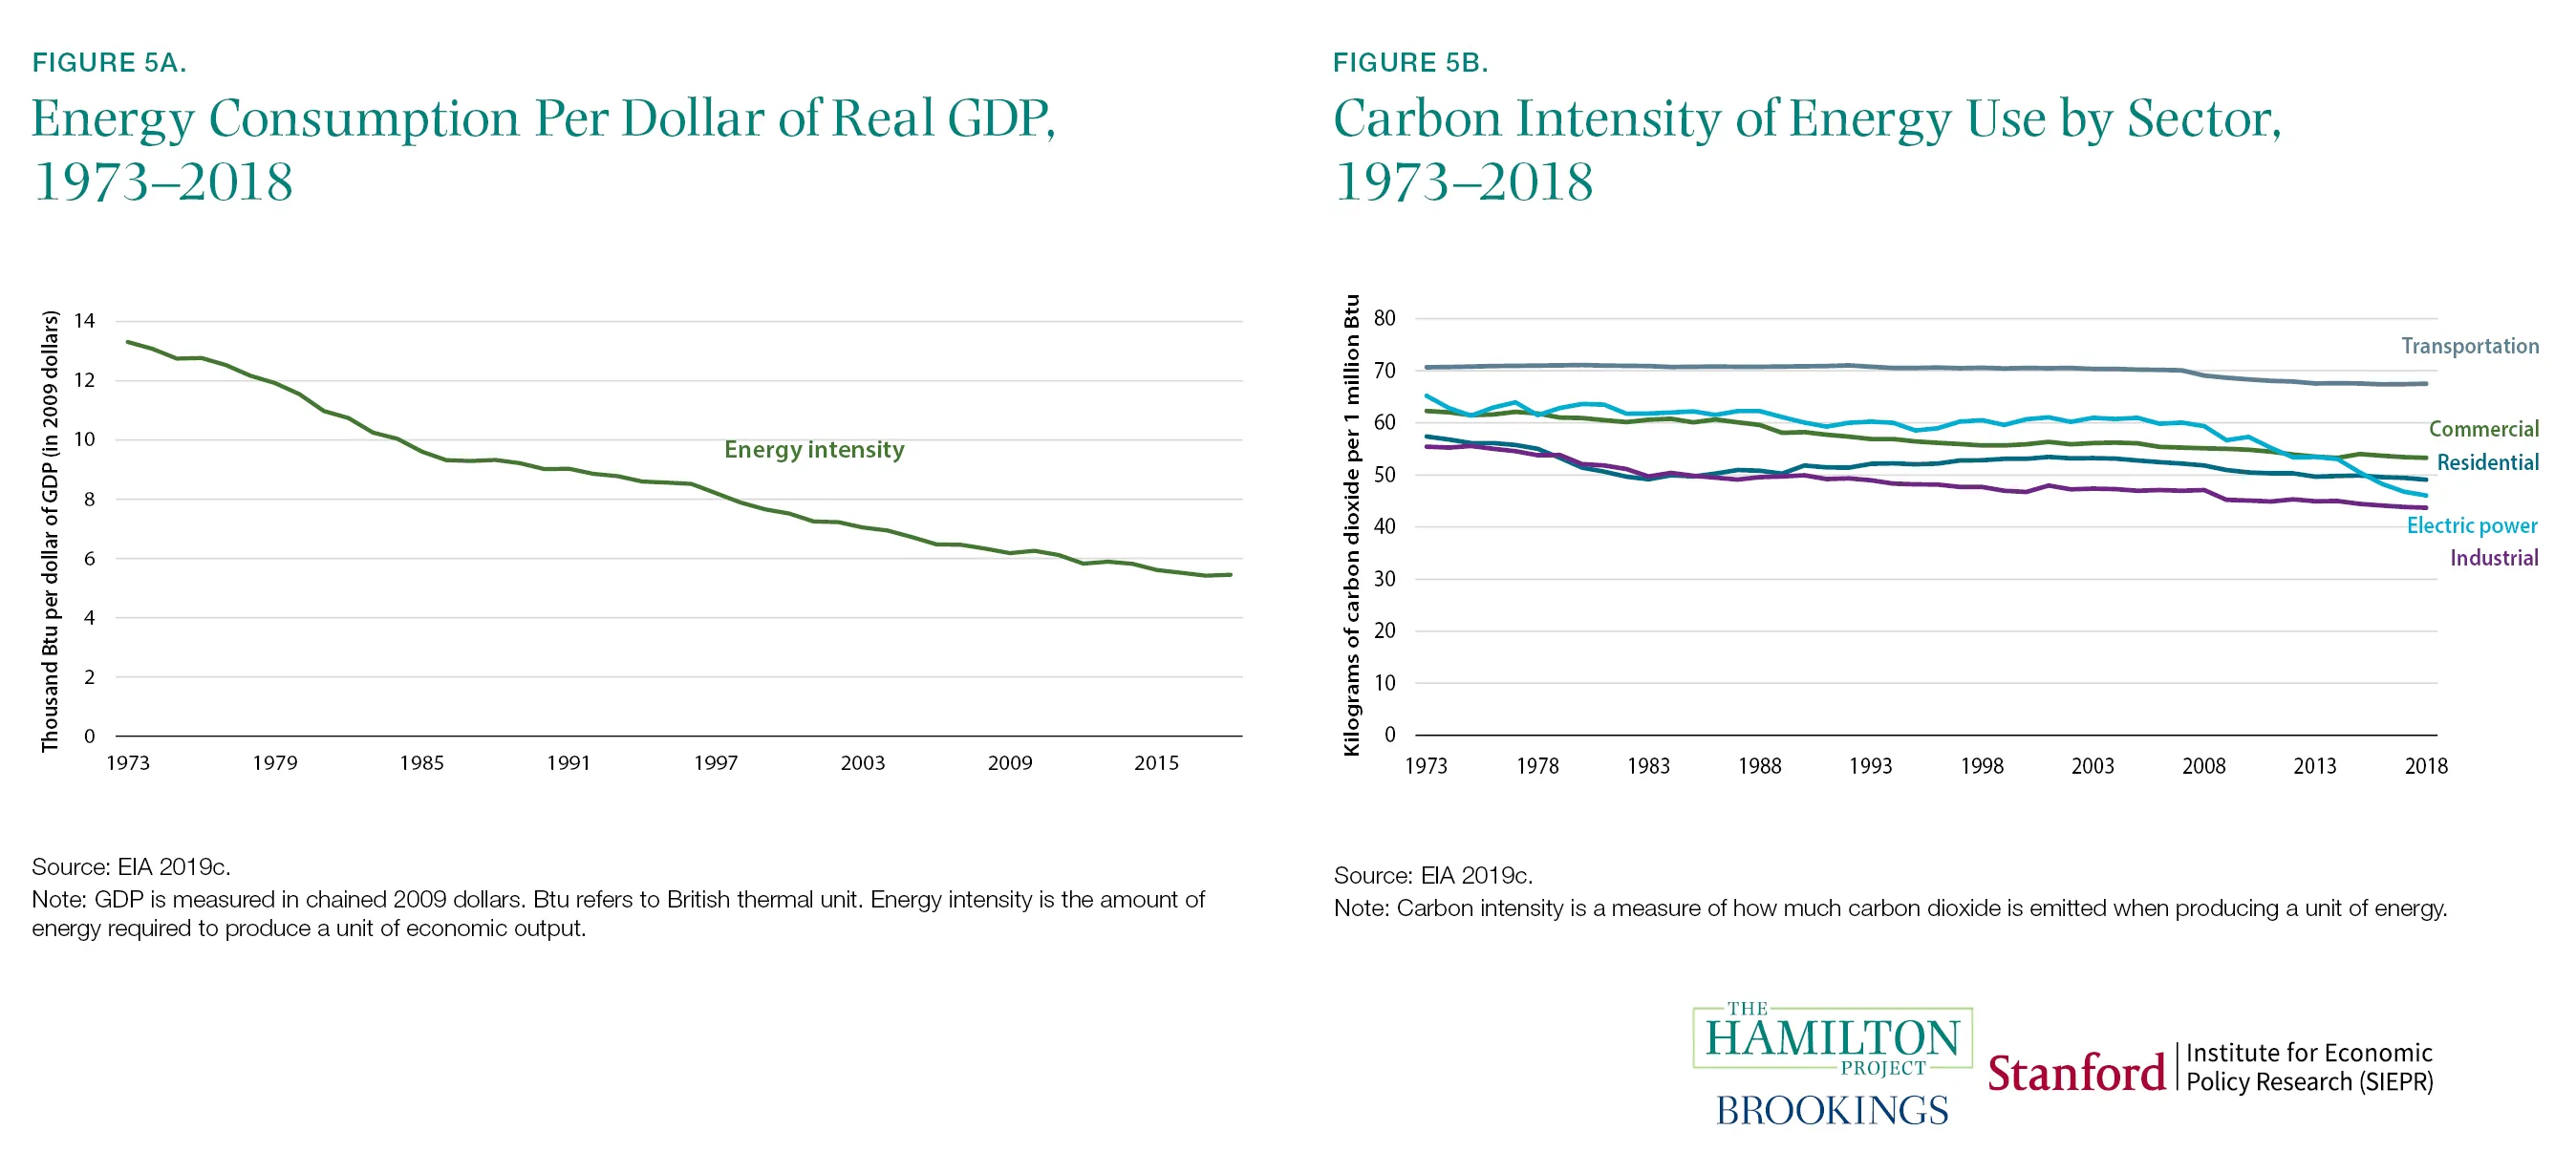
Fact 5: Energy intensity and carbon intensity have been falling in the U.S. economy.
The high-damage climate outcomes described in previous facts are not inevitable: There are good reasons to believe that substantial emissions reductions are attainable. For example, not only has the emissions-to-GDP ratio of the U.S. economy declined over the past two decades, but during the last decade the absolute level of emissions has declined as well, despite the growth of the economy. From a peak in 2007 through 2017, U.S. carbon emissions have fallen 14 percent while output grew 16 percent (Bureau of Economic Analysis 2007–17; U.S. Environmental Protection Agency [EPA] 2007–17; authors’ calculations). This reversal was produced by a combination of declining energy intensity of the U.S. economy (figure 5a) and declining carbon intensity of U.S. energy use (figure 5b). However, emissions increased in 2018, which suggests that sound policy will be needed to continue making progress (Rhodium Group 2019).
U.S. energy intensity (defined as energy consumed per dollar of GDP) has been falling both in times of economic expansion and contraction, allowing the economy to grow even as energy use falls. This has been crucial for mitigating climate change damages (CEA 2017; Obama 2017). Some estimates suggest that declining energy intensity has been the biggest contributor to U.S. reductions in carbon emissions (EIA 2018). Technological advancements and energy efficiency improvements have in turn driven the reduction in energy intensity (Metcalf 2008; Sue Wing 2008).
At the same time that energy intensity has fallen, the carbon intensity of energy use has also fallen in each of the major sectors (shown in figure 5b). Improved methods for horizontal drilling have led to substantial increases in the supply of low-cost natural gas and less use of (relatively carbon-intensive) coal (CEA 2017).[7] Technological advances have also helped substantially reduce the cost of providing power from renewable energy sources like wind and solar. From 2008 to 2015, roughly two thirds of falling carbon intensity in the power sector came from using cleaner fossil fuels and one third from an increased use of renewables (CEA 2017). Non-hydro-powered renewable energy has risen substantially over a short period of time, from 4 percent of all net electricity generation in 2009 to 10 percent in 2018 (EIA 2019a; authors’ calculations).
Fact 6: The price of renewable energy is falling.
The declining cost of producing renewable energy has played a key role in the trends described in fact 5. Figure 6 shows the declining prices of solar and wind energy—not including public subsidies—over the 2010–17 period. Because these price decreases have followed largely from technology induced supply increases, solar and wind energy now play a more-important role in the U.S. energy mix (CEA 2017). In many settings, however, clean energy remains more expensive on average than fossil fuels (The Hamilton Project [THP] and the Energy Policy Institute at the University of Chicago [EPIC] 2017), highlighting the need for continued technological advances.
The increasing share of renewables in energy supply is due in part to cost-reducing advances in technology and increased exploitation of economies of scale. Government subsidies—justified by the social costs of carbon emissions—for renewable energy have also played a role. When the negative spillovers from CO2 emissions are incorporated into the price of fossil fuels, many forms of clean energy are far cheaper than many fossil fuels (THP and EPIC 2017). However, making a much broader use of clean energy faces technological hurdles that have not yet been fully addressed. Renewable energy sources are in many cases intermittent—they make power only when the wind blows or the sun shines—and shifting towards more renewable energy production may require substantial improvements in battery technology and changes to how the electricity market prices variability (CEA 2016). The technological developments that drive falling clean energy prices are the product of public and private investments. In a Hamilton Project policy proposal, David Popp (2019) examines ways to encourage faster development and deployment of clean energy technologies.
Fact 7: Some emissions abatement approaches are much more costly than others.
There are many ways to reduce net carbon emissions, from better livestock management to renewable fuel subsidies to reforestation. Each of these abatement strategies comes with its own costs and benefits. To facilitate comparisons, researchers have calculated the cost per ton of CO2-equivalent emissions.[8] We show high and low estimates of these average costs in figure 7, reproduced from Gillingham and Stock (2018).[9]
Less-expensive programs and policies include the Clean Power Plan—a since-discontinued 2014 initiative to reduce power sector emissions—as well as methane flaring regulations and reforestation. By contrast, weatherization assistance and the vehicle trade-in policy Cash for Clunkers are more expensive (see figure 7). It is important to recognize that some policies may have goals other than emissions abatement, as with Cash for Clunkers, which also aimed to provide fiscal stimulus after the Great Recession (Li, Linn, and Spiller 2013; Mian and Sufi 2012).
But when the goal is to reduce emissions at the lowest cost, economic theory and common sense suggest that the cheapest strategies for abating emissions should be implemented first. State and federal policy choices can play an important role in determining which of the options shown in figure 7 are implemented and in what order.
A common approach is to impose certain emissions standards—for example, a low-carbon fuel standard. The difficulty with this approach is that, in some cases, standards require abatement methods involving relatively high costs per ton while some low-cost methods are not implemented. This can reflect government regulators’ limited information about abatement costs or political pressures that favor some standards over others. By contrast, a carbon price—discussed in facts 8 through 10—helps to achieve a given emissions reduction target at the minimum cost by encouraging abatement actions that cost less than the carbon price and discouraging actions that cost more than that price.
However, policies other than a carbon price are often worthy of consideration. In a Hamilton Project proposal, Carolyn Fischer describes the situations in which clean performance standards can be implemented in a relatively efficient manner (2019).[10]
Fact 8: Numerous carbon pricing initiatives have been introduced worldwide, and the prices vary significantly.
At the local, national, and international levels, 57 carbon pricing programs have been implemented or are scheduled for implementation across the world (World Bank 2019). Figure 8 plots some of the key national and U.S. subnational initiatives, showing carbon taxes in green and cap and trade in purple. By imposing a cost on emissions, a carbon price encourages activities that can reduce emissions at a cost less than the carbon price.
Immediately apparent from figure 8 is the wide range of the carbon prices, reflecting the range of carbon taxes and aggregate emissions caps that different governments have introduced. At the highest end is Sweden with its price of $126 per ton; by contrast, Poland and Ukraine have imposed prices just above zero.[11] A sufficiently high carbon price would change the cost-benefit assessment of some existing nonprice policies, as described in a Hamilton Project proposal by Roberton Williams (2019).
A crucial question for policy is the appropriate level of a carbon price. According to economic theory, efficiency is maximized when the carbon price is equal to the social cost of carbon.[12] In other words, a carbon price at that level would not only facilitate the adoption of the lowest-cost abatement activities (as discussed under fact 7) but would also achieve the level of overall emissions abatement that maximizes the difference between the climate-related benefits and the economic costs.[13] Although setting the carbon price equal to the social cost of carbon maximizes net benefits, the monetized environmental benefits also exceed the economic costs when the carbon price is below (or somewhat above) the optimal value.
Estimates of the social cost of carbon depend on a wide range of factors, including the projected biophysical impacts associated with an incremental ton of CO2 emissions, the monetized value of these impacts, and the discount rate applied to convert future monetized damages into current dollars.[14] As of 2016, the Interagency Working Group on Social Cost of Carbon—a partnership of U.S. government agencies—reported a focal estimate of the social cost of carbon (SCC) at $51 (adjusted for inflation to 2018 dollars) per ton of CO2 (indicated by the dashed line in figure 8).[15]
Fact 9: Most global GHG emissions are still not covered by a carbon pricing initiative.
Just as important as the carbon price is the share of global emissions facing the price. Many countries do not price carbon, and in many of the countries that do, important sources of emissions are not covered. When implementing carbon prices, policymakers have tended to start with the power sector and exclude some other emissions sources like energy-intensive manufacturing (Fischer 2019).
The carbon pricing systems that do exist are not evenly distributed across the world (World Bank 2019). Programs are heavily concentrated in Europe, Asia, and, to a lesser extent, North America. This distribution aligns roughly with the distribution of emissions, though the United States is an outlier: as discussed in the introduction, Europe has generated 33 percent of global CO2 emissions since 1850, the United States 25 percent, and China 13 percent (Ritchie and Roser 2017; authors’ calculations). According to currently scheduled and implemented initiatives, in 2020 the United States will be pricing only 1.0 percent of global GHG emissions; by comparison, Europe will be pricing 5.5 percent, and China will be pricing 7.0 percent (see figure 9).
Figure 9 shows each region’s priced emissions—including both implemented and planned (in 2020) carbon pricing—as a share of total global emissions. Between 2005 and 2012, the European Union’s cap and trade program was the only major carbon pricing program. However since the Paris Agreement, there has been a growing number of implemented and scheduled programs, with the largest of these being China’s national cap and trade program set to take effect in 2020. Despite this activity, it is likely that a carbon price will still not be applied to 80 percent of global emissions of GHGs in 2020 (World Bank 2019; authors’ calculations).
Fact 10: Proposed U.S. carbon taxes would yield significant reductions in CO2 and environmental benefits in excess of the costs.
To assess proposals for a national U.S. carbon price, it is important to understand the size of the likely emissions reduction. Figure 10 shows projections of emissions reductions from Barron et al. (2018) under different assumptions about the level and subsequent growth rate of a U.S. carbon price. Over the 2020-30 period a carbon tax starting at $25 per ton in 2020 and increasing at 1 percent annually above the rate of inflation achieves a reduction in CO2 of 10.5 gigatons, or an 18 percent reduction from the baseline (emissions level in 2005). A more-ambitious $50 per ton price, rising at 5 percent subsequently, would reduce near-term emissions by an estimated 30 percent.[16]
A major attraction of using carbon pricing to achieve emissions reductions (as compared to adopting standards and other conventional regulations for this purpose) is its ability to induce the market to adopt the lowest-cost methods for reducing emissions. As of late 2019, nine U.S. states participate in the Regional Greenhouse Gas Initiative (RGGI), in which electric power plants trade permits that currently have a market price of around $5.20 per short ton of carbon 10. Proposed U.S. carbon taxes would yield significant reductions in CO2 and environmental benefits in excess of the costs. (RGGI Inc. 2019).[17] That means that electric power plants covered under the RGGI are able to find methods of emissions abatement at a cost of $5.20 per ton at the margin and would buy permits at that price rather than undertake any abatement opportunities at a higher cost. A lower aggregate cap—or a higher carbon tax—would continue to select for the abatement approaches that have the lowest costs per ton for a given sector.
Even at much higher levels, emissions pricing leads to environmental benefits—reduced climate and other environmental damages—that exceed the economic sacrifices involved (i.e., the expense of reducing emissions).[18] A central estimate of the social cost of carbon (in 2018 dollars) is $51 per ton (Interagency Working Group on Social Cost of Carbon 2016). However, many recent proposals have tended to entail carbon prices below this level.[19] Goulder and Hafstead (2017) find that a U.S. carbon tax of $20 per ton in 2019, increasing at 4 percent in real terms for 20 years after that, yields climate related benefits that exceed the economic costs by about 70 percent.[20]
The authors did not receive financial support from any firm or person for this article or from any firm or person with a financial or political interest in this article. None of the authors is currently an officer, director, or board member of any organization with a financial or political interest in this article.
JAMMU: A Jammu court’s order to register an FIR against the six members of the Special Investigation team (SIT) in the Kathua rape-and-murder case has raised question marks over the authencity of the probe done by them so far in the sensitive case. The order to file an FIR against the SIT team comes on a petition filed by three youngsters who claim they were torutured to depose against Vishal Jangotra, the boy who was later acquitted in the henious crime.
It may be recalled that the Kathua rape-and-murder case of an eight-year-old Gujjar Bakarwal girl had made national headlines, causing a massive uproar in the country. The public outcry over the case had led to an in-camera trial in Punjab’s Pathankot, outside J&K.
In its order dated October 22, the Court of the Judicial Magistrate (CJM), Prem Sagar, allowed that an FIR be registered against six police officers who have been identified as RK Jalla (Former SSP Crime Branch, Jammu), Peerzada Naveed (Additional Superintendent of Police Crime Branch, Jammu), Shwetambari Sharma (Deputy SP Crime Branch, Jammu), Nassir Hussain (Deputy SP Crime Branch Jammu) Urfan Wani (sub-inspector crime branch Jammu) and Kewal Kishore (crime branch).
The court order said, “the applicants were coerced/tortured/forced by applicants (SIT) to give false evidence against accused Vishal Jangotra” seeking the registration of FIR. In the two-page order, the court directed SSP Jammu to file an FIR and report compliance by the next date of hearing on November 7.
The court order mentions that the applicants in the case had filed a complaint before the SHO of Pacca Danga Police Station in Jammu on September 24 2019 seeking registration of an FIR under section 194 of the IPC (giving or fabricating false evidence with intent to procure conviction of capital offence) and other relevant provisions of the law against the members of the SIT.
The applicants argued that the grounds of registration of FIR were how Sachin Sharma and Neeraj Sharma from Kathua district and Sahil Sharma from adjacent Samba district were “forced/tortured/coerced by all the members of the SIT to depose and create false evidence against accused Vishal Jangotra”.
Vishal Jangotra, the son of chief conspirator Sanji Ram serving a 25-year jail term in the case, was acquitted. Sanji Ram was convicted and sentenced along with five other conspirators on June 10, 2019, by a special court in Punjab’s Pathankot.
Out of the six convicted, Ram and two others were awarded life term while three were sentenced to a jail term of five years.
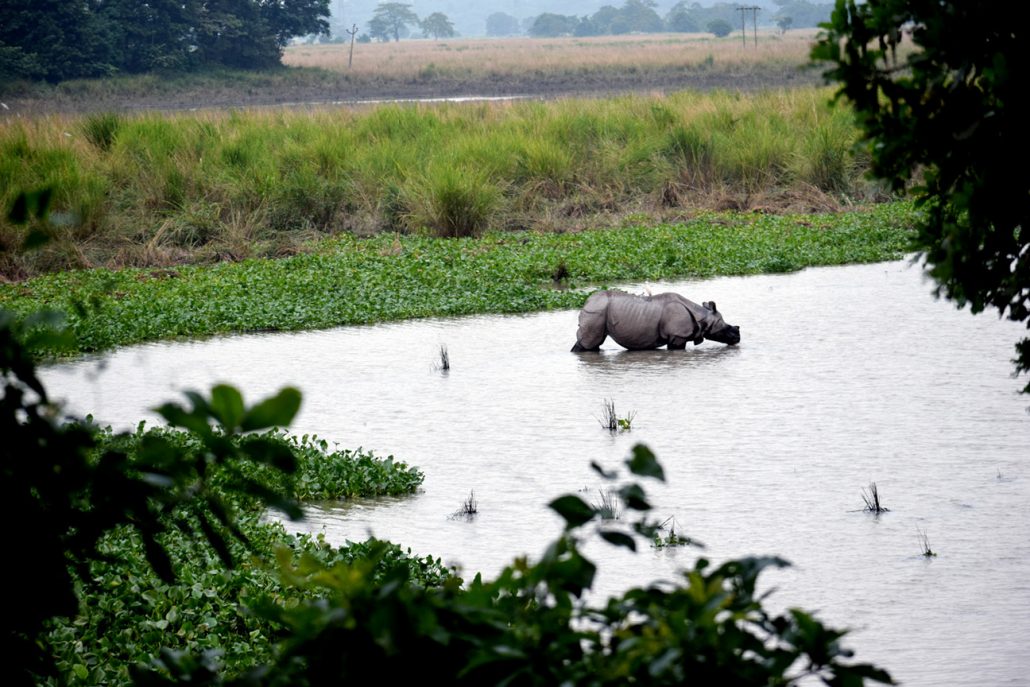
Pobitora Wildlife Sanctuary authority could not open the sanctuary on Tuesday for jeep safari and elephant safari due to anthrax outbreak which resulted in the death of two wild buffaloes in the sanctuary on October 16.
Few other buffaloes have also been affected by anthrax and this has posed a serious threat to the one-horned rhino and the local people as well. Humans can become infected with anthrax disease through contact with an infected animal.
Anthrax is a serious infectious disease caused by gram-positive, rod-shaped bacteria known as Bacillus anthracis. Although it is rare, people can get sick with anthrax if they come in contact with infected animals or contaminated animal products, as stated in a report by the Centre for Disease Control (CDC).
Based on reports, the deaths occurred last week and the carcasses have been disposed of as per the guidelines.
Following the outbreak, forest department officials have been taking precautionary measures to control the spread of the disease.
A team of veterinary doctors have also been allocated for the mass inoculation of livestock in the region and the Forest Department has issued an advisory for preventive measures to ensure that the disease does not spread any further.
Further, the veterinary department has vaccinated domestic elephants and the entry of domestic animals in the reserve has been restricted for the time being.
Thus, the reopening of Pobitora Wildlife Sanctuary has been postponed till further notice.