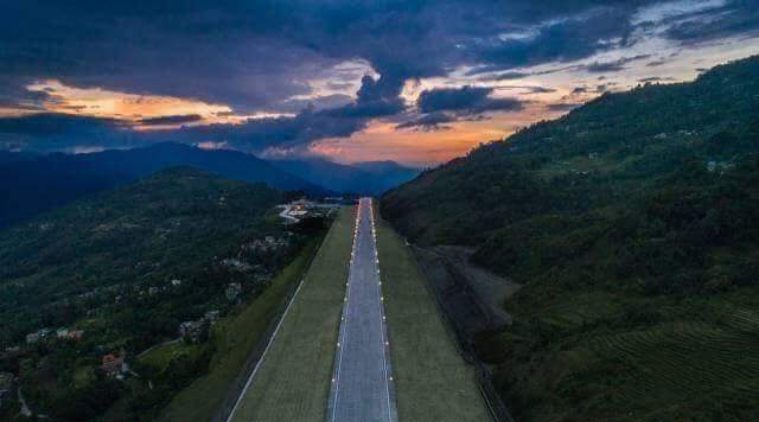
Prime Minister Narendra Modi inaugurated the Pakyong Airport in Sikkim on September 24, nine years after the foundation stone was laid.
The airport is the hilly state’s first and only airport.
PM Modi had spoken about the inauguration of the airport on September 23 during the launch of Centre’s Ayushman Bharat-National Health Protection Mission from Ranchi, Jharkhand. The prime minister had said that that it will improve connectivity and benefit the people of Sikkim
Currently, the nearest airport for the people of Sikkim is 124 kilometre (km) away in Bagdogra, West Bengal.
Here’s all you want to know about it:
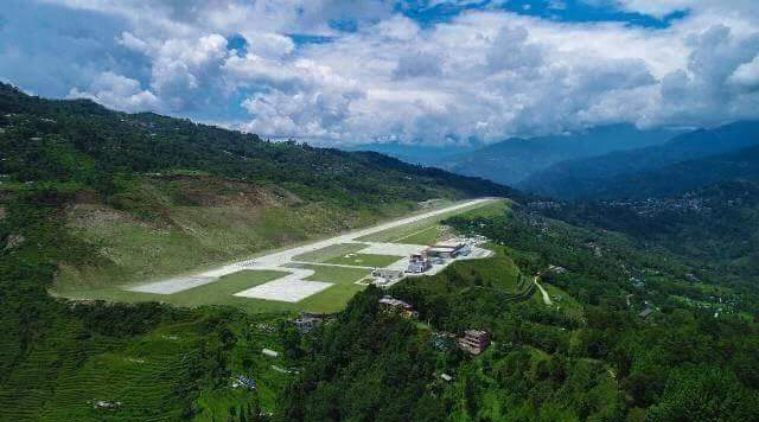
> The foundation stone for the greenfield airport was laid in Pakyong in 2009, which is around 33 km from Gangtok — the state capital. The airport is located around 60 km from the Indo-China border.
It is constructed by the Airports Authority of India (AAI). The project cost Rs 553 crore.
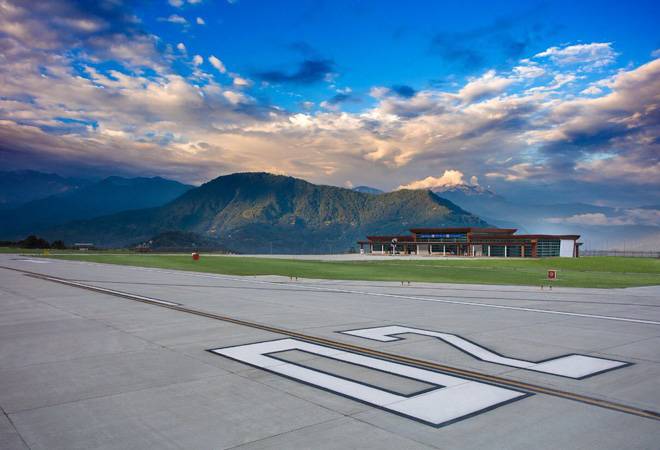
> The airport is seen as an engineering marvel for its soil reinforcement and slope stabilisation techniques, keeping in view the altitude it was built at.
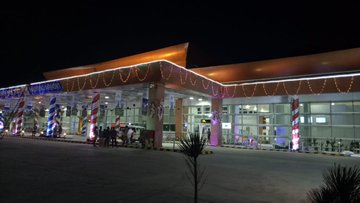
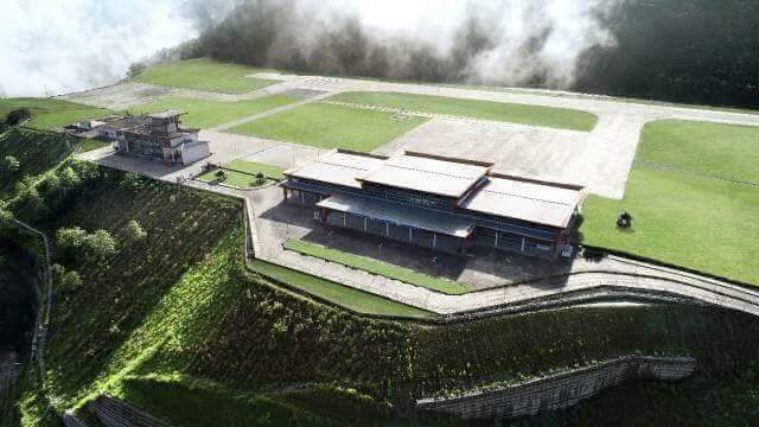
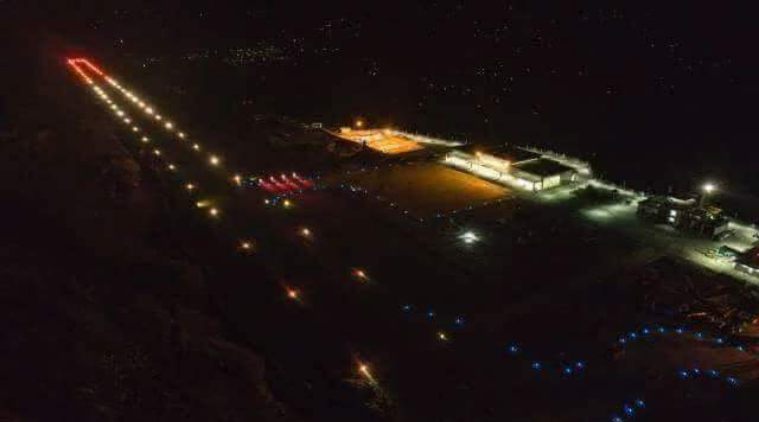
> Integrated structures of the airport comprise of an ATC tower-cum-fire station, a terminal building for passengers, high-intensity runway lights, parking for over 50 vehicles.
> The reinforcement wall of the project is 80-metre-high — one of the tallest in the world.
> The runway is 1.75 km long and is 30 metres wide. It has a 116-metre taxiway connecting the runway to an apron measuring 106 metre by 76 metre. The apron can accommodate two ATR-72 aircraft.
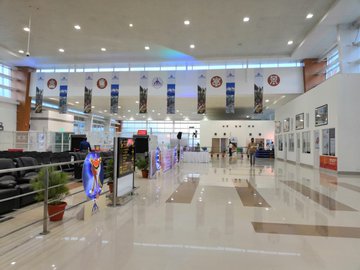
> The airport has 3,000 square metre terminal building and has a capacity to handle 50 in-bound and out-bound passengers.
> Although the airport will be inaugurated on September 24, the commercial operations are expected to begin on October 4.
> There is also plan to construct another 75-metre stretch adjacent to the main runway in the coming days, which would allow the Indian Air Force (IAF) to land various types of aircraft on the airport’s runway.(With inputs from PTI)
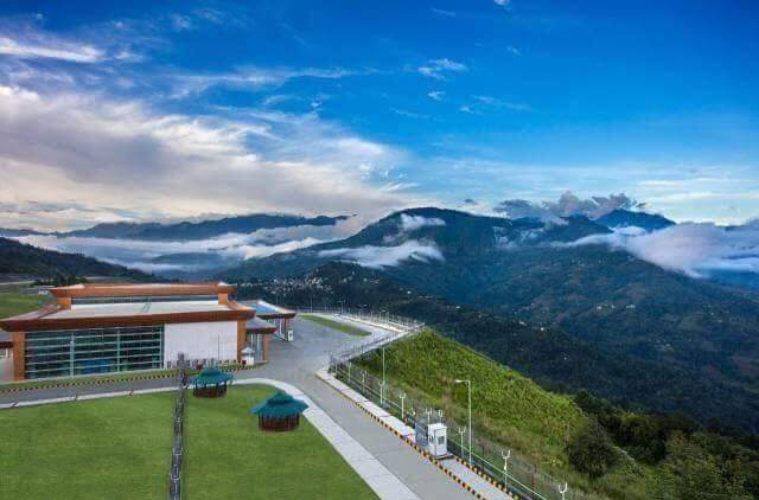
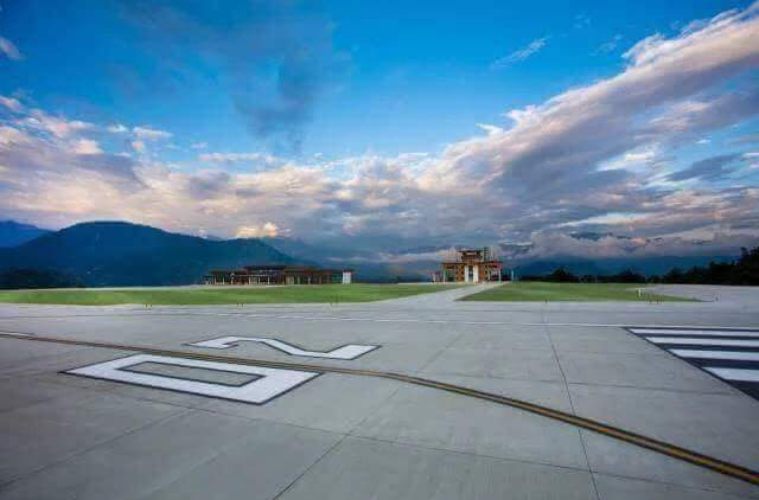
Perched between the Himalayan ranges at a height of 4,500 ft, flights from Sikkim’s first ever airport in the small town of Pakyong are set to take off from September 23.
XSikkim will finally get its own airport — the Pakyong airport is perched between the Himalayan ranges at a height of 4,500 ft.
To visit Sikkim by air means landing at West Bengal’s Bagdogra airport, then travelling 124 km uphill on winding roads to reach its capital, Gangtok. However, from September 23, Sikkim will finally get its own airport — perched between the Himalayan ranges at a height of 4,500 ft! The Pakyong airport will be the country’s 100th functional airport — and on September 23, Prime Minister Narendra Modiwill fly in to inaugurate it.
The Pakyong airport will be the country’s 100th functional airport. Photo Courtesy: Airports Authority of India (AAI)
The greenfield airport — the Northeast’s first — which has been conceived at a budget of Rs 605.59 crore is skilfully engineered to include soil reinforcement and slope stabilisation techniques in context of the altitude it has been built in.
From October 8, SpiceJet will operate daily flights under the Union Civil Aviation Ministry’s UDAN scheme.
Photo Courtesy: Airports Authority of India (AAI)
“Greenfield airports have their own beauty and merits. You will experience them when flights start operating. Moreover, the airport will have multi-dimensional benefits for Sikkim which will gradually come to the fore with time,” said Ugen T Gyatso Bhutia, Minister of Civil Aviation and Tourism department, Government of Sikkim. The airport — located in the small town of Pakyong in East Sikkim — is about 30 km from Gangtok.
The greenfield airport — the Northeast’s first — which has been conceived at a budget of Rs 605.59 crore. Photo Courtesy: Airports Authority of India (AAI)
Earlier this year, on March 5, the Indian Air Force’s Dornier 228 was tested from Pakyong. Later, SpiceJet followed by conducting test runs of the 78-seater Bombardier Q400 from Kolkata to Pakyong on March 10. This led to security clearances for commercial operations.
The airport — located in the small town of Pakyong in East Sikkim — is about 30 km from Gangtok.
Photo Courtesy: Airports Authority of India (AAI)
From October 8, SpiceJet will operate daily flights to and from Kolkata and Guwahati under the Union Civil Aviation Ministry’s UDAN (Ude Desh Ka Aam Nagrik) scheme that aims to enhance regional connectivity. Fare prices are pegged at Rs 2,600.
The airport will be inaugurated by PM Narendra Modi on September 23. Photo Courtesy: Airports Authority of India (AAI)
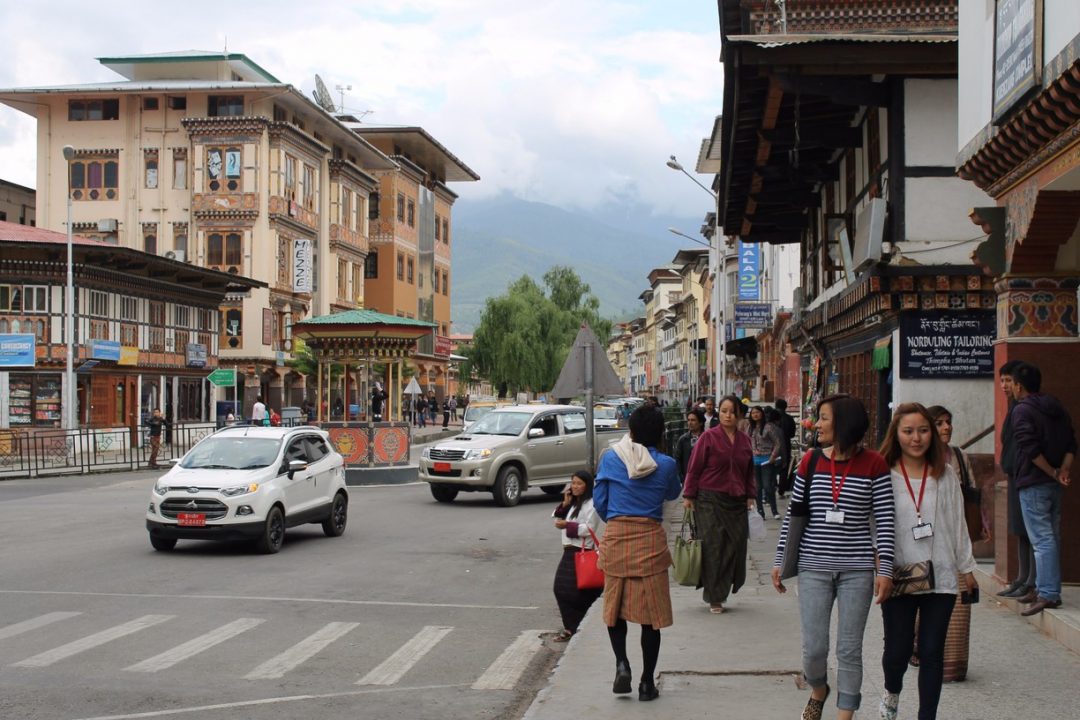
“Also, gradually, the airport will connect Sikkim with other countries in the region like Bhutan, Kathmandu and Bangkok where people from the state usually go on vacations,” said Bhutia. ( Indian Express)
Bhutan ranks 134 out of 189 countries on the Human Development Index (HDI) in 2017, climbing a step up from its 135 rank in 2016, according to the Human Development Indices and Indicators: 2018 Statistical Update that the United Nations Development Programme (UNDP) released online yesterday.
Bhutan’s HDI value at 0.612 puts the country in the medium human development category. A press release from the UN country office states that Bhutan shares its rank with Kiribati. InSouth Asia, countries that are close to Bhutan in the 2017 HDI rank and to some extent in population size are the Maldives, which ranks 101 and Nepal, 149.
However, when the value is discounted for inequality, the HDI drops to 0.446, a loss of 27.2 percent due to inequality in the distribution of the HDI dimension indices, the press release states. The Maldives and Nepal show losses due to inequality of 23.4 percent and 25.6 percent respectively. The average loss due to inequality for medium HDI countries is 25.1 percent and 26.1 percent for South Asia.
Between 2005 and 2017, Bhutan’s HDI value increased from 0.510 to 0.612, an increase of 20.1 percent. Between 1990 and 2017, Bhutan’s life expectancy at birth increased by 17.7 years, mean years of schooling by 0.8 years, expected years of schooling by 6.9 years and GNI per capita by about 284.2 percent.
Bhutan has a Gender Inequality Index value of 0.476, ranking it 117 out of 160 countries in the 2017 index. The country has 8.3 percent of parliamentary seats held by women, and 6 percent of adult women have reached at least a secondary level of education compared to 13.7 percent of their male counterparts. For every 100,000 live births, 148 women die from pregnancy related causes. Female participation in the labour market is 58 percent compared to 74.3 for men. In comparison, Maldives ranks 76 and Nepal 118 on this index.
The top five countries in the HID rankings are Norway, Switzerland, Australia, Ireland, and Germany while the bottom five are Burundi, Chad, South Sudan, Central African Republic and Niger.
The Human Development Index focuses on three basic dimensions of human development: the ability to lead a long and healthy life, measured by life expectancy at birth; the ability to acquire knowledge, measured by mean years of schooling and expected years of schooling; and the ability to achieve a decent standard of living, measured by gross national income per capita.
The 2018 Statistical Update highlights that across the world, people are living longer, are more educated and have greater livelihood opportunities.
The average lifespan is seven years longer than it was in 1990, and more than 130 countries have universal enrollment in primary education. However, progress since 1990 has not always been steady. Some countries suffered reversals due to conflicts, epidemics or economic crises. Human deprivations remain high despite overall progress, the press release states.
When taking into account inequality in the distribution of achievements of HDI indicators, the global HDI of 0.728 in 2017 falls to 0.582, representing a 20 percent loss and a drop from the high to the medium HDI category. Worldwide inequality in the distribution of income is the highest (22.6 percent) followed by inequality in achievements in education (22.0 percent) and health (15.2 percent).
By region, Sub-Saharan Africa had the highest regional loss in the HDI because of inequality (30.8 percent), followed by South Asia (26.1 percent) and the Arab States (25.1 percent). Europe and Central Asia remain the regions with the lowest overall losses in HDI from inequality at 11.7 percent.
The statistical update also indicates that women have lower HDI than men across regions and face specific barriers to empowerment all through life. Worldwide, the average HDI for women is 6 percent lower than for men. The HDI for men is 0.749 while for women it is 0.705. At the global level, the gap in HDI between women and men is due to women’s lower income and educational attainment in many countries.
At the global level, 44 percent of combined achievements in reproductive health, empowerment and labour market is lost due to inequality in achievements between men and women in these dimensions, as measured by the Gender Inequality index.Among developing regions, Europe and Central Asia have the smallest inequality between men and women (with a GII of 27 percent). Sub-Saharan Africa has the highest GII (of 57 percent), followed by the Arab States (53 percent) and South Asia (52 percent).
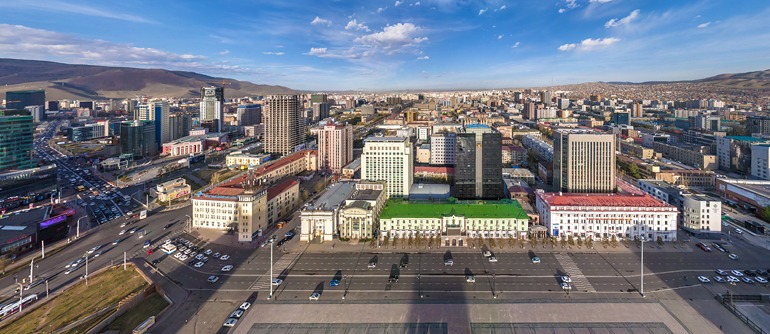
On August 23, 2018, when
jointly meeting the press with Minister of Foreign Affairs Damdin
Tsogtbaatar of Mongolia in Ulaanbaatar, State Councilor and Foreign
Minister Wang Yi said that the Belt and Road Initiative is an
international public product that China provides for the world. It is
neither a “Marshall Plan”, nor a geostrategic concept. Ever since the
very beginning of proposing the Belt and Road Initiative, the Chinese
side has been adhering to the principle of extensive consultation, joint
contribution and shared benefits, sticking to the concept of
transparency, openness and inclusiveness, complying with international
rules and laws of various countries, pursuing green, environmental
protection and sustainability, striving to build projects featuring high
quality and high standard, and also laying emphasis on financial
sustainability. These important proposals and ideas are consistent with
the opening-up strategy featuring mutual benefit and win-win results
that China has upheld for a long time, and also serve as China’s vivid
practice of building a community with a shared future for mankind
together with countries around the globe.
Wang Yi pointed out that
the Belt and Road Initiative aims to exploit new cooperation space and
tap into new cooperation potential through integrating the development
strategies of various countries, thus achieving common development and
shared prosperity. In this process, the Chinese side is willing to share
its development opportunities with various countries and welcome
everyone to catch a ride on the express train of China’s development.
The Belt and Road Initiative is in conformity with the trend of the
times and is full of vitality, thereby receiving immediate global
support and response.
In response to questions
about how China and Mongolia should promote the joint construction of
the Belt and Road Initiative, Wang Yi said that China and Mongolia are
connected by mountains and rivers, which makes Mongolia a natural
partner for the joint construction of the Belt and Road Initiative. The
participation of the Mongolian side in the Belt and Road Initiative will
give new wings to and provide new impetus for its own development and
revitalization. China and Mongolia have signed a cooperation agreement
to integrate the Belt and Road Initiative and Prairie Road Development
initiative. The Chinese side is willing to attach great importance to
Mongolia’s national development goals and the needs of the Mongolian
people, and also speed up the integration process to jointly build the
Belt and Road Initiative.
Wang Yi said that first
of all, we are willing to fully support Mongolia in accelerating its
infrastructure construction, so as to help Mongolia to break the
bottleneck of its development and create development conditions.
Second, we will focus
more on improving the people’s livelihood in Mongolia, so that all
Mongolian people can obtain tangible benefits from the participation in
the building of the Belt and Road Initiative.
Third, we will pay more
attention to environmental and ecological conservation, and work hand in
hand with the Mongolian side to build a green Silk Road, so as to
conserve and develop the green mountains and clear waters in Mongolia.
Fourth, we would like to
help Mongolia turn its resource advantages into development advantages,
and boost its processing and manufacturing industries, thus helping
Mongolia to achieve diversified development and improve its capabilities
of independent and sustainable development.
In short, the cooperation
between China and Mongolia can be compared to mutual assistance between
friends and mutual support between neighbors. As President Xi Jinping
said, China’s cooperation with Mongolia is not about one wins and the
other loses or one wins more and the other gets less, but commits to
realizing mutual benefit.
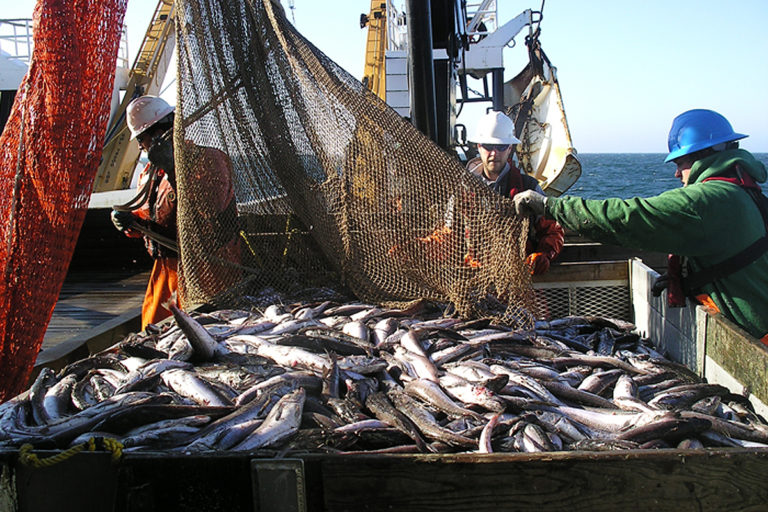
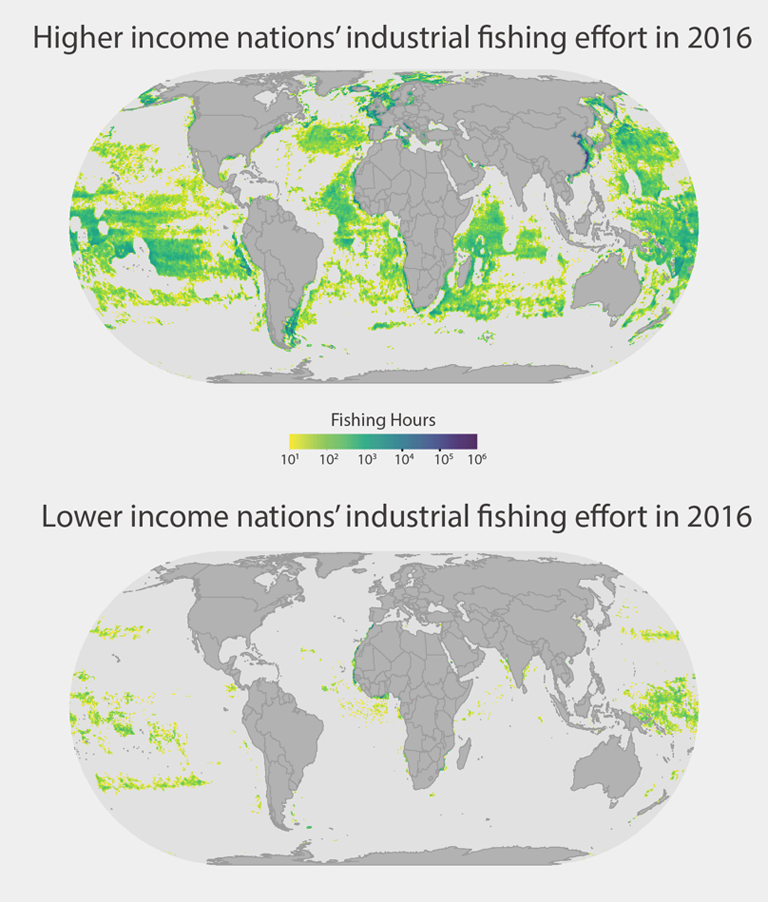
A study led by researchers at the University of California, Santa Barbara (UCSB) in the United States shows that wealthy countries’ industrial fishing fleets don’t just dominate Earth’s oceans, they have a virtual monopoly on them, especially on the high seas.
The researchers found that vessels registered to wealthy countries are responsible for 78 percent of trackable industrial fishing in the waters of less-wealthy countries and a whopping 97 percent on the high seas, international waters that are outside of any one country’s jurisdiction.
Five higher-income countries are responsible for a disproportionate amount of the industrial fishing effort on the high seas: China, Taiwan, Japan, South Korea, and Spain (in order of dominance).
Recent research found that, despite having expanded into 90 percent of the world’s oceans, the industrial fishing fleets of the top 20 fishing countries in the world are catching less than a third of the fish they hauled in prior to 1950.
Findings like these are increasingly calling into question the sustainability of how we exploit global fisheries even as the global human population continues to climb. The more humans there are on the planet, the more we will have to rely on fish as an important source of food — and there are already about 3.2 billion people who rely on fish for 20 percent or more of their animal protein, which has driven 33.1 percent of the world’s fisheries to be operated at “biologically unsustainable levels,” according to the UN Food and Agriculture Organization.
Another study, published earlier this month in the journal Science Advances, helps put a finer point on just why access to declining fisheries could be a major food issue going forward. The study, led by researchers at the University of California, Santa Barbara (UCSB) in the United States, shows that wealthy countries’ industrial fishing fleets don’t just dominate Earth’s oceans, they have a virtual monopoly on them, especially on the high seas.
The researchers found that vessels registered to wealthy countries are responsible for 78 percent of trackable industrial fishing in the waters of less-wealthy countries and a whopping 97 percent on the high seas, international waters that are outside of any one country’s jurisdiction. What’s more, just five higher-income countries dominate the vast majority of industrial fishing on the high seas.
6,500 semi-trucks could fit inside the net of a single large industrial fishing vessel’s trawl net. The researchers focused their analysis on industrial fisheries because of the massive scale of these fisheries. Industrial fisheries also control most of the world’s fish. Graphic courtesy of Douglas McCauley.
“Seafood keeps millions of people on our planet a hair’s breadth away from diseases associated with malnutrition,” Douglas McCauley, an assistant professor in UCSB’s Department of Ecology, Evolution, and Marine Biology and co-lead author of the study, said in a statement. “This means that accurately describing these patterns by which seafood is shared matters as much for our own future as it matters for the future of fish.”
McCauley and team analyzed 22 billion data points from a tracking system that ships use to avoid collisions at sea known as the Automatic Identification System, or AIS for short. The data was processed using machine-learning algorithms by Global Fishing Watch, an NGO that tracks and shares global fishing data in near-real time. This allowed the researchers to determine the amount of industrial fishing done by vessels flagged to higher-income nations — a combination of the countries the World Bank categorizes as “high income” and “upper middle income” — and lower-income nations — the World Bank’s “lower middle income” and “low income” categories combined.
“Advanced machine learning techniques allow us to identify fishing behavior without needing an analyst to look at the tracks of every single vessel,” study co-author David Kroodsma of Global Fishing Watch said in a statement. “It would take an analyst years, if not decades, to make the same number of judgements about vessel behavior.”
The results of the team’s analysis show that the exploitation of global fisheries is highly unequal. Less than 3 percent of industrial fishing on the high seas is conducted by vessels flagged to lower-income nations. When it comes to national waters, or the Exclusive Economic Zones (EEZs) that extend 200 nautical miles from all non-landlocked countries’ coastlines, vessels flagged to higher-income nations are just as dominant, making up some 97 percent of all industrial fishing effort tracked in 2016.
As might be expected, domestic fishing fleets dominate the national waters of wealthier countries, responsible for 89 percent of fishing efforts in the EEZs of higher-income nations and 93 percent in the EEZs of upper middle-income countries. Meanwhile, 84 percent of the industrial fishing effort in lower-income countries’ EEZs is done by vessels flagged to foreign countries — and 78 percent of those vessels are flagged to high- and upper middle-income nations.
Five higher-income countries are responsible for a disproportionate amount of the industrial fishing effort on the high seas: China, Taiwan, Japan, South Korea, and Spain (in order of dominance). Just China and Taiwan together account for about 52 percent of industrial fishing tracked on the high seas, “which, by reference, is an amount approximately 12 and 27 times greater than the high seas fishing effort detected for the United States and Russia (two other large nations), respectively,” the researchers write in the study.
There are only two lower-income nations among the top 20 in terms of the amount of AIS-detectable industrial fishing on the high seas: Vanuatu and Ukraine. And even that may be a deceptive statistic, given that Vanuatu has an open vessel registry, meaning it is what is often referred to as a “flag of convenience” state, and many vessels controlled by higher-income foreign nations are reported to mask their activities by registering in Vanuatu.
China and Taiwan also account for 44 percent of foreign fishing vessels that operate in the EEZs of other countries. “We detected fishing effort from China alone in the marine waters of approximately 40% of all non-landlocked nations,” the researchers write. “China, Taiwan, and South Korea (from high to low) also carried out the highest amounts of foreign fishing effort recorded globally in lower-income EEZs, or approximately 63% of all such effort detected.”
This analysis is especially timely given that the UN is set to convene the first intergovernmental talks for a treaty to protect marine biodiversity and govern the high seas in September. The researchers say they plan to engage with the UN to make their data readily available. The available data on industrial fishing, McCauley and team suggest, is more detailed than for any other natural resource and can help inform decision-making around the design of the treaty
“We cannot track assets in mining or forestry with anywhere near the precision that we are now able to track fishing vessels,” McCauley said. “This is a game changer when it comes to empowering both international leaders and on-the-ground citizens to make intelligent decisions about how best to manage the future of their own marine resources.”
by Mongabay.com on August 14, 2018
CITATION
• McCauley, D. J., Jablonicky, C., Allison, E. H., Golden, C. D., Joyce, F. H., Mayorga, J., & Kroodsma, D. (2018). Wealthy countries dominate industrial fishing. Science advances, 4(8), eaau2161. doi:10.1126/sciadv.aau2161